

Money Fund Intelligence
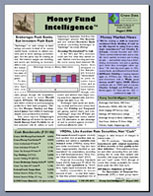
Money Fund Intelligence is a must-read for money market mutual fund and cash investment professionals. The monthly PDF contains:
- Money Market News - Coverage of cash happenings, new products, companies in the news, people, and more.
- Feature Articles - Stories like "Trading Portals", "Enhanced Cash", and "Brokerages Push Banks".
- Money Fund Profiles - In-depth interviews with portfolio managers and management teams.
- Fund Performance/Rankings - Full listings of fund 7-day yields, monthly and longer-term returns (1-, 3-, 5-, and 10-year), assets, expense ratios, and more.
- Crane Money Fund Indexes - Our benchmark money market averages by fund type, plus Brokerage Sweep and Bank Indexes.
Whether you're comparing a fund to the competition, benchmarking your cash portfolio to the market, looking for an investment, or looking for new product ideas, Money Fund Intelligence is the answer. E-mail us for the latest issue!
Issues
Latest Contents (July 1, 2024)
| AFP Liquidity Survey: Banks, MMFs | 1 |
| Money Fund Symposium '24: Records | 1 |
| ICI Worldwide: MMFs Rise to $10.4T | 1 |
| Money Mkt News, Benchmarks | 1 |
| Brokerage Sweep & Bank Saving | 8 |
| People, Calendar, Subscription | 8 |
| Top Performing Tables, Indexes | 9-12 |
| Fund Performance Listings | 13-26 |
The content page contains archives and delivery settings for all subscriptions.
| Product Summary | ||
|---|---|---|
| Price | $500/yr | ( Discount Policy ) |
| News |

|
( Articles ) |
| Ranks |
|
( All ) |
| Funds |
|
( Profile Info ) |
| Archives |
|
( Summaries ) |
| Index |
|
( Components ) |
| Next Steps | ||
| Subscribe Now » | ||
| See a demo issue. | ||
| Request a trial issue. | ||
| Call 1-508-439-4419 for order or info. | ||
Money Fund Intelligence News
Jun 07
The June issue of our flagship Money Fund Intelligence newsletter, which was sent out to subscribers Friday morning, features the articles: "Allspring, UBS, Dreyfus, DWS All File Plans to Leave Prime," which covers the continued exodus from Prime Institutional MMFs; "ICI 2024 Fact Book Shows Money Fund Trends in '23," which quotes from ICI's annual compilation of fund statistics; and, "Money Funds Largest Buyers of T-Bills Says JPM; Berkshire," which looks at holders of Treasuries. We also sent out our MFI XLS spreadsheet Friday a.m., and we've updated our Money Fund Wisdom database with 5/31/24 data. Our June Money Fund Portfolio Holdings are scheduled to ship on Tuesday, June 11, and our June Bond Fund Intelligence is scheduled to go out on Monday, June 17. (Note: Register ASAP for our Money Fund Symposium next week in Pittsburgh, June 12-14. We hope you'll join us!)
MFI's "Prime Exit" article says, “Another batch of Prime Institutional money market funds filed to liquidate or convert to Government in May, bringing the total of Prime exits to 10 to date. Allspring, formerly the Wells Fargo Funds, is the latest to announce an exit ahead of the SEC's pending emergency mandatory liquidity fee rules (which go into effect October 2). A Product Alert titled, 'Allspring to Merge Two Money Market Funds' tells us, 'The Allspring Funds Board of Trustees has approved the merger of the [$3.1 billion] Allspring Heritage Money Market Fund into the Allspring Government Money Market Fund. The merger is expected to take place at the close of business on or around August 16, 2024."
The piece continues, "It adds, 'Note that the Service Class of the Heritage Money Market Fund will merge into the Administrator Class of the Government Money Market Fund, and the Administrator Class of the Heritage Money Market Fund will merge into the Institutional Class of the Government Money Market Fund.' (See the Prospectus Supplement for the Allspring Institutional Money Market Funds.)"
We write in our ICI 2024 Fact Book article, “The Investment Company Institute released its '2024 Investment Company Fact Book’ an annual compilation of statistics and commentary on the mutual fund space. Subtitled, 'A Review of Trends and Activities in the Investment Company Industry,' the latest edition tells us, 'Worldwide net sales of money market funds totaled $1.5 trillion in 2023, up from $161 billion in 2022 (Figure 1.7). The increase in worldwide demand for money market funds was spread across all geographical regions but was primarily driven by a substantial increase in net inflows in the United States. Investor demand for money market funds in the United States increased from $1 billion in 2022 to $1.1 trillion in 2023. In the Asia-Pacific region, money market funds experienced net inflows of $136 billion in 2023, about even with the net inflows of $132 billion in 2022.'"
ICI continues, "It explains, 'Investors use money market funds because they are professionally managed, tightly regulated vehicles with holdings limited to high-quality, short-term debt instruments <b:>`_. As such, they are highly liquid, attractive, cash-like alternatives to bank deposits. [D]emand for money market funds is dependent upon their yields and interest rate risk exposure relative to other high-quality fixed-income securities.'"
Our "Treasury Bills" piece says, "J.P. Morgan's most recent 'Short-Term Market Outlook And Strategy' writes that, 'Yes, T-bill demand should remain robust.' They comment, 'While the outcome of the upcoming November election remains highly uncertain, the one thing we know is that the US fiscal deficit will remain large in the coming years, regardless of who wins. As our Treasury strategists note, given Treasury's current net coupon borrowing capacity and their estimates of the budget deficit forecasts over the medium term, Treasury will likely remain underfunded in FY26 and beyond.... Reading between the lines, it appears there is a possibility that the T-bill share of the market could migrate above the current recommended range over time.'"
It tells us, "The piece continues, 'If so, we believe the markets will have no issues digesting the additional T-bill supply, with demand remaining robust. Indeed, even as T-bill outstandings have grown by $2tn over the past year, the impact on T-bill/SOFR spreads has been marginal thanks to the available pool of liquidity at the ON RRP, underscoring the sheer amount of demand for T-bills in the current market environment.... Perhaps more importantly, when we look at the buyer base of the T-bill market, we see the demand from several key buyers remaining substantial, if not expanding, in the near term.'"
MFI also includes the News brief, "MMF Assets Rebound in May." It states, "Money fund assets jumped $79.7 billion to $6.466 trillion in May (after falling $17.6 billion in April and $68.5B in March). Year-to-date, MMFs are up by $147.3 billion, or 2.3%. Over 12 months, money funds have risen by $611.3 billion, or 10.4%."
Another News brief, "Citi's Williams on Impact from MMF Reforms: No Big Deal; Assets Higher. Citi Research recently published a research piece titled, 'Short-End Notes Impact from MMF reform and AUM expectations,' which tells us, 'Do not expect a repeat of 2016 this October.' Author Jason Williams writes, 'We've gotten multiple questions on the front-end impact due to the full implementation of the new money market fund reform, specifically the SEC's liquidity fee which is set to turn on in October.'"
A sidebar, "DWS ESG Fund Liquidating," says, "A Prospectus Supplement filing for the $505 million DWS ESG Liquidity Fund tells us, 'Upon the recommendation of DWS Investment Management Americas, Inc., the investment advisor for DWS ESG Liquidity Fund, the Board of Trustees of Investors Cash Trust has authorized, on behalf of the fund, the fund's termination and liquidation, which will be effective on or about August 14, 2024. Accordingly, the fund will redeem all of its outstanding shares on the Liquidation Date. The liquidation will be effected according to a Plan of Liquidation and Termination. The costs of the liquidation, including the mailing of notification to shareholders, will be borne by the fund but reimbursed by the Advisor, after taking into account applicable contractual expense caps.'"
Our June MFI XLS, with May 31 data, shows total assets increased $79.7 billion to $6.466 trillion, after decreasing $17.6 billion in April, $66.7 billion in March, increasing $50.0 billion in February, $87.0 billion in January, $24.5 billion in December and $219.8 billion in November. Assets decreased $39.3 billion in October, but increased $77.8 billion in September, $104.2 billion in August, $21.0 billion in July and $20.3 billion in June.
Our broad Crane Money Fund Average 7-Day Yield was unchanged at 5.03%, and our Crane 100 Money Fund Index (the 100 largest taxable funds) was up 1 bp to 5.14% in May. On a Gross Yield Basis (7-Day) (before expenses are taken out), the Crane MFA and the Crane 100 averaged 5.40% and 5.41%, respectively. Charged Expenses averaged 0.37% and 0.27% for the Crane MFA and the Crane 100. (We'll revise expenses on Monday once we upload the SEC's Form N-MFP data for 5/31/24.) The average WAM (weighted average maturity) for the Crane MFA was 34 days (down 1 bp from previous month) and the Crane 100 WAM was unchanged at 35 days. (See our Crane Index or craneindexes.xlsx history file for more on our averages.)
May 10
Crane Data's May Money Fund Portfolio Holdings, with data as of April 30, 2024, show that Repo holdings jumped while Treasuries plunged and CP fell. Money market securities held by Taxable U.S. money funds (tracked by Crane Data) decreased by $61.4 billion to $6.241 trillion in April, after decreasing $63.1 billion in March. Assets increased $66.9 in February, $86.6 in January, $51.1 billion in December and $244.0 billion in November. They decreased $57.9 billion in October, but increased $56.1 in September, $106.7 billion in August and $78.3 billion in July. Repo continued to bounce back and reclaimed its spot as the largest portfolio segment, increasing $94.9 billion, after a steep slide two months prior. Treasuries plummeted by $144.9 billion, falling to the No. 2 spot among portfolio segments. The U.S. Treasury continues to be the single largest Issuer to MMFs. `In April, U.S. Treasury holdings fell to $2.395 trillion, while FICC Repo jumped $20.4 billion to $512.3 billion, surpassing the Fed RRP's $508.0 billion total (which fell $28.8 billion). Agencies were the third largest segment, CP remained fourth, ahead of CDs, Other/Time Deposits and VRDNs. Below, we review our latest Money Fund Portfolio Holdings statistics.
Among taxable money funds, Repurchase Agreements (repo) increased $94.9 billion (4.0%) to $2.454 trillion, or 39.3% of holdings, in April, after increasing $13.4 billion in March, decreasing $137.6 billion in February, decreasing $163.2 billion in January and increasing $74.8 billion in December. Treasury securities fell $144.9 billion (-5.7%) to $2.395 trillion, or 38.4% of holdings, after decreasing $19.6 billion in March. Treasuries increased $206.2 billion in February, $104.7 billion in January and $69.6 billion in December. Government Agency Debt was up $3.8 billion, or 0.5%, to $721.0 billion, or 11.6% of holdings. Agencies decreased $14.2 billion in March and $6.7 billion in February. They increased $43.9 billion in January, but decreased $21.8 billion in December. Repo, Treasuries and Agency holdings now total $5.570 trillion, representing a massive 89.2% of all taxable holdings.
Money fund holdings of CP and CDs decreased in April, while Time Deposits rose. Commercial Paper (CP) decreased $30.7 billion (-10.1%) to $273.3 billion, or 4.4% of holdings. CP holdings decreased $3.9 billion in March and $2.1 billion in February, increased $18.6 billion in January and decreased $14.8 billion in December. Certificates of Deposit (CDs) decreased $2.2 billion (-1.0%) to $215.2 billion, or 3.4% of taxable assets. CDs decreased $18.7 billion in March, increased $0.8 billion in February and $19.5 billion in January, and decreased $5.4 billion in December. Other holdings, primarily Time Deposits, increased $17.7 billion (11.6%) to $170.5 billion, or 2.7% of holdings, after decreasing $20.3 billion in March, increasing $5.7 billion in February and $63.4 billion in January, and decreasing $52.1 billion in December. VRDNs rose to $12.2 billion, or 0.2% of assets. (Note: This total is VRDNs for taxable funds only. We will post our Tax Exempt MMF holdings separately Friday around noon.)
Prime money fund assets tracked by Crane Data fell to $1.363 trillion, or 21.8% of taxable money funds' $6.241 trillion total. Among Prime money funds, CDs represent 15.8% (up from 15.7% a month ago), while Commercial Paper accounted for 20.1% (down from 21.8% in March). The CP totals are comprised of: Financial Company CP, which makes up 13.1% of total holdings, Asset-Backed CP, which accounts for 5.2%, and Non-Financial Company CP, which makes up 1.8%. Prime funds also hold 3.6% in US Govt Agency Debt, 16.4% in US Treasury Debt, 17.4% in US Treasury Repo, 0.3% in Other Instruments, 10.5% in Non-Negotiable Time Deposits, 6.2% in Other Repo, 7.5% in US Government Agency Repo and 0.7% in VRDNs.
Government money fund portfolios totaled $3.180 trillion (51.0% of all MMF assets), down from $3.190 trillion in March, while Treasury money fund assets totaled another $1.698 trillion (27.2%), down from $1.724 trillion the prior month. Government money fund portfolios were made up of 21.1% US Govt Agency Debt, 18.8% US Government Agency Repo, 29.8% US Treasury Debt, 30.1% in US Treasury Repo, 0.0% in Other Instruments. Treasury money funds were comprised of 72.1% US Treasury Debt and 27.9% in US Treasury Repo. Government and Treasury funds combined now total $4.878 trillion, or 78.2% of all taxable money fund assets.
European-affiliated holdings (including repo) increased by $101.9 billion in April to $778.9 billion; their share of holdings rose to 12.4% from last month's 10.7%. Eurozone-affiliated holdings increased to $499.5 billion from last month's $453.7 billion; they account for 7.9% of overall taxable money fund holdings. Asia & Pacific related holdings rose to $299.7 billion (4.8% of the total) from last month's $281.0 billion. Americas related holdings fell to $5.157 trillion from last month's $5.336 trillion, and now represent 81.8% of holdings.
The overall taxable fund Repo totals were made up of: US Treasury Repurchase Agreements (up $79.0 billion, or 5.0%, to $1.668 trillion, or 26.7% of assets); US Government Agency Repurchase Agreements (up $11.9 billion, or 1.7%, to $701.0 billion, or 11.2% of total holdings), and Other Repurchase Agreements (up $3.9 billion, or 4.9%, from last month to $84.7 billion, or 1.4% of holdings). The Commercial Paper totals were comprised of Financial Company Commercial Paper (down $18.4 billion to $178.0 billion, or 2.9% of assets), Asset Backed Commercial Paper (down $5.6 billion to $71.2 billion, or 1.1%), and Non-Financial Company Commercial Paper (down $6.7 billion to $24.1 billion, or 0.4%).
The 20 largest Issuers to taxable money market funds as of April 30, 2024, include: the US Treasury ($2.395T, 38.4%), Federal Home Loan Bank ($590.3B, 9.5%), Fixed Income Clearing Corp ($512.3B, 8.2%), the Federal Reserve Bank of New York ($508.0B, or 8.1%), JP Morgan ($171.7B, 2.8%), Citi ($143.3B, 2.3%), BNP Paribas ($140.4B, 2.2%), RBC ($138.6B, 2.2%), Federal Farm Credit Bank ($124.7B, 2.0%), Bank of America ($123.9B, 2.0%), Barclays PLC ($119.7B, 1.9%), Goldman Sachs ($109.3B, 1.8%), Credit Agricole ($70.3B, 1.1%), Wells Fargo ($68.9B, 1.1%), Sumitomo Mitsui Banking Corp ($64.1B, 1.0%), Mitsubishi UFJ Financial Group Inc ($63.9B, 1.0%), Societe Generale ($55.7B, 0.9%), Mizuho Corporate Bank Ltd ($52.5B, 0.8%), Toronto-Dominion Bank ($51.6B, 0.8%) and Canadian Imperial Bank of Commerce ($48.8B, 0.8%).
In the repo space, the 10 largest Repo counterparties (dealers) with the amount of repo outstanding and market share (among the money funds we track) include: Fixed Income Clearing Corp ($512.3B, 20.9%), the Federal Reserve Bank of New York ($508.0B, 20.7%), JP Morgan ($162.2B, 6.6%), Citi ($131.2B, 5.3%), BNP Paribas ($127.7B, 5.2%), RBC ($111.4B, 4.5%), Goldman Sachs ($108.7B, 4.4%), Bank of America ($99.6B, 4.1%), Barclays ($98.7B, 4.0%) and Wells Fargo ($58.5B, 2.4%). The largest users of the $508.0 billion in Fed RRP include: Vanguard Federal Money Mkt Fund ($95.6B), Vanguard Cash Reserves Federal MM ($34.0B), Fidelity Cash Central Fund ($32.6B), Goldman Sachs FS Govt ($32.0B), Fidelity Govt Money Market ($26.7B), Northern Instit Treasury MMkt ($24.4B), Schwab Value Adv MF ($21.7B), Federated Hermes Govt Oblig ($20.0B), Fidelity Sec Lending Cash Central Fund ($18.2B) and Fidelity Inv MM: Treas Port ($16.7B).
The 10 largest issuers of "credit" -- CDs, CP and Other securities (including Time Deposits and Notes) combined -- include: Mizuho Corporate Bank Ltd ($32.0B, 5.4%), RBC ($27.3B, 4.6%), Toronto-Dominion Bank ($26.0B, 4.4%), Bank of America ($24.3B, 4.1%), Credit Agricole ($23.2B, 3.9%), DNB ASA ($22.3B, 3.7%), Barclays PLC ($21.0B, 3.5%), Bank of Montreal ($19.9B, 3.3%), Mitsubishi UFJ Financial Group Inc ($18.7B, 3.1%) and Canadian Imperial Bank of Commerce ($18.0B, 3.0%).
The 10 largest CD issuers include: Bank of America ($16.4B, 7.6%), Sumitomo Mitsui Banking Corp ($14.8B, 6.9%), Credit Agricole ($13.7B, 6.3%), Mizuho Corporate Bank Ltd ($13.4B, 6.2%), Toronto-Dominion Bank ($12.3B, 5.7%), Sumitomo Mitsui Trust Bank ($10.5B, 4.9%), Mitsubishi UFJ Financial Group Inc ($10.5B, 4.9%), Wells Fargo ($10.4B, 4.8%), Canadian Imperial Bank of Commerce ($9.2B, 4.3%) and Mitsubishi UFJ Trust and Banking Corporation ($8.7B, 4.1%).
The 10 largest CP issuers (we include affiliated ABCP programs) include: RBC ($16.8B, 6.8%), Toronto-Dominion Bank ($13.6B, 5.5%), Bank of Montreal ($11.9B, 4.8%), Barclays PLC ($11.4B, 4.6%), JP Morgan ($9.5B, 3.9%), BPCE SA ($9.4B, 3.8%), Mitsubishi UFJ Financial Group Inc ($8.1B, 3.3%), Bank of Nova Scotia ($7.7B, 3.1%), Landesbank Baden-Wurttemberg ($7.6B, 3.1%) and BSN Holdings Ltd ($7.0B, 2.9%).
The largest increases among Issuers include: Barclays PLC (up $39.2B to $119.7B), Citi (up $29.1B to $143.3B), JP Morgan (up $22.7B to $171.7B), Credit Agricole (up $22.5B to $70.3B), Fixed Income Clearing Corp (up $20.4B to $512.3B), Societe Generale (up $12.6B to $55.7B), Federal Home Loan Bank (up $11.8B to $590.3B), Bank of America (up $10.1B to $123.9B), Mizuho Corporate Bank Ltd (up $9.5B to $52.5B) and Erste Group Bank AG (up $8.5B to $9.0B).
The largest decreases among Issuers of money market securities (including Repo) in April were shown by: US Treasury (down $144.9B to $2.395T), RBC (down $66.1B to $138.6B), the Federal Reserve Bank of New York (down $28.8B to $508.0B), Goldman Sachs (down $5.3B to $109.3B), National Bank of Canada (down $4.8B to $7.8B), Bank of Nova Scotia (down $4.7B to $26.4B), Canadian Imperial Bank of Commerce (down $4.5B to $48.8B), Mitsubishi UFJ Financial Group Inc (down $4.2B to $63.9B), Rabobank (down $2.5B to $12.9B) and HSBC (down $2.3B to $33.4B).
The United States remained the largest segment of country-affiliations; it represents 77.5% of holdings, or $4.835 trillion. Canada (5.2%, $322.4B) was in second place, while France (5.1%, $315.9B) was No. 3. Japan (4.4%, $272.3B) occupied fourth place. The United Kingdom (3.2%, $196.5B) remained in fifth place. Netherlands (1.1%, $65.6B) was in sixth place, followed by Germany (0.9%, $57.0B), Sweden (0.8%, $51.0B), Australia (0.6%, $38.7B), and Norway (0.4%, $22.3B). (Note: Crane Data attributes Treasury and Government repo to the dealer's parent country of origin, though money funds themselves "look-through" and consider these U.S. government securities. All money market securities must be U.S. dollar-denominated.)
As of April 30, 2024, Taxable money funds held 48.2% (up from 44.6%) of their assets in securities maturing Overnight, and another 11.4% maturing in 2-7 days (down from 12.4%). Thus, 59.6% in total matures in 1-7 days. Another 12.1% matures in 8-30 days, while 9.7% matures in 31-60 days. Note that over three-quarters, or 81.3% of securities, mature in 60 days or less, the dividing line for use of amortized cost accounting under SEC regulations. The next bucket, 61-90 days, holds 5.4% of taxable securities, while 8.3% matures in 91-180 days, and just 5.0% matures beyond 181 days. (Visit our Content center to download, or contact us to request our latest Portfolio Holdings reports.)
May 07
The May issue of our flagship Money Fund Intelligence newsletter, which was sent out to subscribers Tuesday morning, features the articles: "Goldman Latest Prime Inst Exit; CP/CDs Should Be Okay," which covers the continued exodus from Prime Institutional MMFs; "Corporate Treasurers Leaning Away from Prime, to SMAs," which quotes from recent TEXPO 2024 & NEAFP conferences; and, "NY Fed Says Money Funds in Europe Reflect Rates Fast Too," which reviews an article from The Federal Reserve Bank of NY. We also sent out our MFI XLS spreadsheet Tuesday a.m., and we've updated our Money Fund Wisdom database with 4/30/24 data. Our May Money Fund Portfolio Holdings are scheduled to ship on Thursday, May 9, and our May Bond Fund Intelligence is scheduled to go out on Tuesday, May 14. (Note: Register soon for our Money Fund Symposium next month in Pittsburgh, June 12-14. We hope you'll join us!)
MFI's "Prime Exit" article says, "The hits keep coming to the Prime Institutional MMF sector, as Goldman Sachs becomes the latest fund firm to announce an exit. A filing for the $1.6 billion Goldman Sachs Financial Square Money Market Fund and the $2.9 billion Goldman Sachs Financial Square Prime Obligations Fund, including its Administration, Capital, Institutional, Preferred, Select, Service, and Drexel Hamilton Class shares, explains, 'At a meeting held on April 16-17, 2024, upon the recommendation of Goldman Sachs Asset Management, the Board ... approved a proposal to liquidate the Goldman Sachs Financial Square Money Market Fund and Goldman Sachs Financial Square Prime Obligations Fund.'"
It continues, "This brings the total of Prime Institutional money funds declaring either pending conversions to Government or pending liquidations to 5 funds to date, representing $229.3 billion in assets, or 34.9% of the $657.0 billion total in Prime Inst MMFs (assets as of 3/31/24)."
We write in our Treasurers Leaning Away article, "Over the past month, a number of money fund providers (as well as Crane Data) attended and spoke at a series of regional corporate treasury events, shedding light on the recent dramatic growth of money funds and the current shifts and changes in money fund lineups. We attended TEXPO 2024, the Texas treasury event in Houston (4/14-16) and New England AFP in Boston (4/25-26), and sat through almost a dozen sessions involving money funds, liquidity and short-term investing. We quote from some of the sessions and highlights below."
It tells us, "TEXPO includes a presentation titled, 'Regulatory, Rate and Regime Changes: A Perfect Storm for Liquidity Investors?' with Jeff Jones of Twisted X, Wes Rager of Invesco, and Brittany O'Shea of Texas Capital. Rager explains, 'So, for us we’re just very defensive. We're trying to stay nimble. Typically in the rate environment that we're in, where we've seen what we think is the last rate hike, you want to start extending your portfolio. But if you extend to soon, you're locking in lower rates for a longer period of time."
Our "NY Fed" piece says, "The Federal Reserve Bank of New York's Liberty Street Economics featured the article, 'Monetary Policy and Money Market Funds in Europe.' It states, 'As shown in a past [post], the yields of money market fund (MMF) shares respond to changes in monetary policy rates much more than the rates of bank deposits; in other words, the MMF beta is much higher than the deposit beta. Consistent with this, the size of the U.S. MMF industry fluctuates over the interest rate cycle, expanding during times of monetary policy tightening. In this post, we show that the relationship between the policy rates of the European Central Bank (ECB) and the size of European MMFs investing in euro-denominated securities is also positive -- as long as policy rates are positive; after the ECB introduced negative policy rates in 2015, that relationship broke down, as MMFs received large inflows during this period.'"
It continues, "The piece explains, 'Similar to their U.S. counterparts, European MMFs can be divided into government funds ... and prime funds based on their portfolio holdings <b:>`_.... European MMFs are regulated under Regulation (EU) 2017/1131 of the European Parliament and of the Council of the European Union (EU), which was adopted in 2017 in response to the 2008 run experienced by MMFs.'"
MFI also includes the News brief, "MMF Assets Fall on Tax Payments." It states, "Money fund assets fell by $17.6 billion to $6.387 trillion in April (after falling $68.5B in March). Outflows from the long Good Friday weekend last month-end and April 15 tax payments have temporarily paused MMFs record run. Over 12 months, money funds have risen by $694.5 billion, or 12.2%, with Taxable Retail MMFs jumping $490.2 billion (26.4%) and Taxable Inst MMFs rising by $186.1 billion (5.0%)."
Another News brief, "The Wall Street Journal's CFO Journal Writes, 'Companies Belly Up to Cash Buffet, in Five Charts.' The article tells us, 'Companies are socking away cash at the fastest rate since the onset of the pandemic. Four years ago, companies boosted their cash holdings to weather economic uncertainty stemming from virus-related lockdowns. Now, with interest rates hovering at two-decade highs, they are allocating more of their portfolios to high-yielding cash ... investments, getting a welcome boost from yields that top 5% on money-market funds.'"
A third News brief, "Barron's Says, 'Money-Market Funds Look Like a Tempting Place for Your Cash.' They write, 'Most of the time, money-market mutual funds are about as exciting as watching paint dry. That's what they're designed to be: boring and reliable. But these days, money funds have gotten interesting. And tempting. Maybe overly tempting.'"
A sidebar, "Payden Limited Maturity 30," says, "A release, 'Payden & Rygel Celebrates 30 Years of the Limited Maturity Fund (PYLMX) Amidst Four Decades of Investment Excellence' states, 'Payden & Rygel is proud to announce the 30-year anniversary of its Limited Maturity Fund (PYLMX).... Payden & Rygel has cemented its reputation as a leader in short-duration strategies.... The short duration strategy team has worked together for 15 years and currently oversees $70 billion in assets.'"
Our May MFI XLS, with April 30 data, shows total assets decreased $17.6 billion to $6.387 trillion, after decreasing $66.7 billion in March, increasing $50.0 billion in February, $87.0 billion in January, $24.5 billion in December and $219.8 billion in November. Assets decreased $39.3 billion in October, but increased $77.8 billion in September, $104.2 billion in August, $21.0 billion in July, $20.3 billion in June and $152.7 billion in May."
Our broad Crane Money Fund Average 7-Day Yield was unchanged at 5.03%, and our Crane 100 Money Fund Index (the 100 largest taxable funds) was down 1 bp to 5.13% in April. On a Gross Yield Basis (7-Day) (before expenses are taken out), the Crane MFA and the Crane 100 averaged 5.40% and 5.40%, respectively. Charged Expenses averaged 0.37% and 0.26% for the Crane MFA and the Crane 100. (We'll revise expenses on Wednesday once we upload the SEC's Form N-MFP data for 4/30/24.) The average WAM (weighted average maturity) for the Crane MFA was 35 days (down 2 bps from previous month) and the Crane 100 WAM was down 3 bps at 35 days. (See our Crane Index or craneindexes.xlsx history file for more on our averages.)
Apr 05
The April issue of our flagship Money Fund Intelligence newsletter, which was sent out to subscribers Friday morning, features the articles: "Pending Reforms Trigger Prime Shift: Federated, Vanguard Go," which covers the budding exodus from Prime Institutional MMFs; "Bond Fund Symposium '24: Ultra-Shorts Look for Bounce," which quotes from our recent ultra-short bond fund conference; and, "Worldwide MF Assets Break $10 Trillion in '23; US Leads," which reviews ICI's latest global money fund statistics. We also sent out our MFI XLS spreadsheet Friday a.m., and we've updated our Money Fund Wisdom database with 3/31/24 data. Our April Money Fund Portfolio Holdings are scheduled to ship on Tuesday, April 9, and our April Bond Fund Intelligence is scheduled to go out on Friday, April 12.
MFI's "Prime Shift" article says, "Federated Money Market Trust is the first Prime Institutional MMF to announce its liquidation ahead of the latest round of SEC MMF Reforms. Vanguard and American Funds filed to convert two large internal money funds as well, and we'll no doubt see more moves over the next several months. The SEC's asset totals ... show Prime MMFs representing $1.4 trillion (as of 2/29/24), or 21.5%, of the $6.5 trillion in total MMFs, with Inst Public totaling $342 billion, Inst Nonpublic totaling $332 billion and Prime Retail totaling $733 billion."
It continues, “A Prospectus Supplement filing for the $1.2 billion Federated Hermes Money Market Obligations Trust, including the Inst (MMPXX), Capital (MMLXX) and Eagle Shares (MMMXX), tells us, 'On Feb. 15, 2024, the Board of Trustees of Federated Hermes Money Market Obligations Trust approved a Plan of Liquidation for the Federated Hermes Institutional Money Market Management pursuant to which the Fund will be liquidated on or about July 12, 2024.... In approving the Liquidation, the Board determined the Liquidation is in the best interests of the Fund and its shareholders. Accordingly, the Fund's investment adviser will take all action necessary to liquidate, dissolve, and wind up the affairs of the Fund.'"
We write in our Bond Fund article, "We recently hosted our latest Crane's Bond Fund Symposium in Philadelphia. Below, we quote from the 'Senior Portfolio Manager Perspectives,' which featured J.P. Morgan Asset Management's Dave Martucci, UBS A.M.'s Dave Rothweiler and PIMCO's Jerome Schneider. (Thanks again to those who supported BFS. Crane Data subscribers may access the recordings and conference materials at the bottom of our 'Content' page or via our 'Bond Fund Symposium 2024 Download Center.')"
It tells us, "Rothweiler comments, 'Looking back to 2022-2023, you had competition from the money funds with higher yields [and] stable NAVs, ... and people pushing to go longer duration. So you were getting hit from both ends.... The Street just doesn't have the balance sheet they used to have. [When] everyone runs out the door at the same time, liquidity is of the utmost importance.'"
Our "Worldwide" piece states, "The Investment Company Institute published, 'Worldwide Regulated Open-Fund Assets and Flows, Fourth Quarter 2023,' recently, which shows that money fund assets globally jumped by $497.0 billion, or 5.1%, in Q4'23 to $10.441 trillion. The increases were led by a sharp jump in money funds in U.S., while Ireland, Luxembourg, France and China also rose. Meanwhile, money funds in Argentina and Belgium were lower. MMF assets worldwide increased by $1.585 trillion, or 19.1%, in the 12 months through 12/31/23, and money funds in the U.S. now represent 56.7% of worldwide assets."
It continues, "ICI's release says, 'Worldwide regulated open-end fund assets increased 8.6% to $68.85 trillion at the end of the fourth quarter of 2023, excluding funds of funds.... [ICI] compiles worldwide regulated open-end fund statistics on behalf of the International Investment Funds Association (IIFA).... The collection for the fourth quarter of 2023 contains statistics from 45 jurisdictions.'"
MFI also includes the News brief, "MMF Assets Dip in March, Rebound to Record $6.538 Trillion on April 2." It states, "Money fund assets fell by $66.7 billion to $6.407 trillion in March, but they've soared by $140.3 billion in the first 2 days of April. Over the past 12 months, money funds have risen by $778 billion, or 13.8%, with Retail MMFs jumping $531.5 billion (29.2%) and Inst MMFs rising by $236.7 billion (6.4%)."
Another News brief, "BlackRock Launches Tokenized MF," comments, "A release entitled, 'BlackRock Launches Its First Tokenized Fund, BUIDL, on the Ethereum Network,' says, 'BlackRock unveil[ed] its first tokenized fund issued on a public blockchain, the BlackRock USD Institutional Digital Liquidity Fund (BUIDL). BUIDL will provide qualified investors with the opportunity to earn U.S. dollar yields by subscribing to the Fund through Securitize Markets, LLC.'"
A third News brief, "ICI: MMF Expense Ratios 0.22% in '23," says, "The Investment Company Institute published, 'Trends in the Expenses and Fees of Funds, 2023,' which tells us, 'Average expense ratios of hybrid and bond mutual funds, as well as money market funds, have ... declined meaningfully since 1996.' A table shows expense ratios by type from 1996 to 2023 and shows bonds fund averages falling from 0.84% to 0.37% over this period and money fund ratios falling from 0.52% to 0.22%. (Note: Crane Data shows the average expense ratio for money market mutual funds at 0.26% as of 2/29/24 as measured by our Crane 100 Money Fund Index.)"
A sidebar, "WSJ on Wall of Cash Bulls," says, "The Wall Street Journal writes, 'Sorry Stock Bulls, the 'Wall of Cash' Isn't All Headed Your Way.' They explain, 'Trillions of dollars are seemingly available to move out of cash funds and be put to work in the stock market. That possibility has had stock-market bulls salivating, but they are probably in for disappointment. Despite the expectation that the Federal Reserve's next move is to cut rates, money-market-fund assets have continued to grow at a fast pace. They are now around $6.5 trillion, according to industry tracker Crane Data. While the S&P 500 is up 8% year to date, total money funds added more than $150 billion in assets through the first two months of 2024, or about $50 billion more than they did in the same period last year, according to Crane.'"
Our April MFI XLS, with March 31 data, shows total assets decreased $66.7 billion to $6.407 trillion, after increasing $50.0 billion in February, $87.0 billion in January, $24.5 billion in December and $219.8 billion in November. Assets decreased $39.3 billion in October, but increased $77.8 billion in September, $104.2 billion in August, $21.0 billion in July, $20.3 billion in June, $152.7 billion in May and $56.5 billion in April."
Our broad Crane Money Fund Average 7-Day Yield was down 1 bp to 5.03%, and our Crane 100 Money Fund Index (the 100 largest taxable funds) was down 1 bp to 5.14% in March. On a Gross Yield Basis (7-Day) (before expenses are taken out), the Crane MFA and the Crane 100 averaged 5.40% and 5.41%, respectively. Charged Expenses averaged 0.37% and 0.26% for the Crane MFA and the Crane 100. (We'll revise expenses on Monday once we upload the SEC's Form N-MFP data for 3/31/24.) The average WAM (weighted average maturity) for the Crane MFA was 37 days (down 1 bp from previous month) and the Crane 100 WAM was down 2 bps at 38 days. (See our Crane Index or craneindexes.xlsx history file for more on our averages.)